

The System: What It Actually Does
At its core, anomaly detection is a compression problem. You take a long history of values—server CPU load, building energy consumption, heart rate—and build a compact description of typical behavior. Then you compare each new observation against that description. If the difference is large enough, you call it an anomaly.
But "large enough" is a judgment call, not a fact. The same numerical deviation can be a harmless blip in one context and a critical failure in another. A spike in CPU usage at 2 a.m. might be a batch job; the same spike at 2 p.m. might be a runaway process. The system has to encode that context, or it will cry wolf.
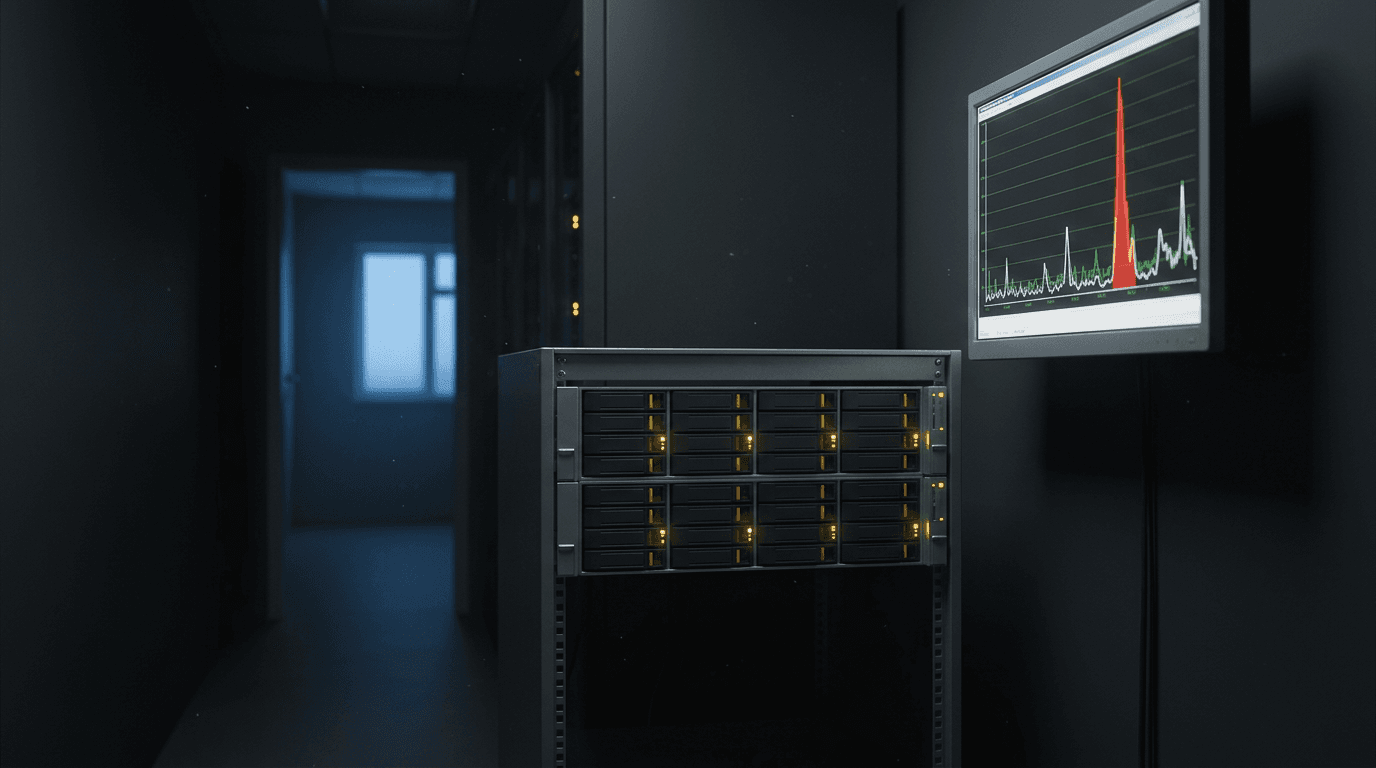
Forecasting-based methods work by predicting the next value and measuring the prediction error. If the error exceeds a threshold, the point is flagged. The threshold choice is where the design lives. Too tight, and every minor fluctuation becomes an incident. Too loose, and real problems slip through. The literature often uses prediction error as a novelty score, but that score is only useful if the model's notion of "normal" matches your operational reality.
Each Layer: Sensor, Model, App
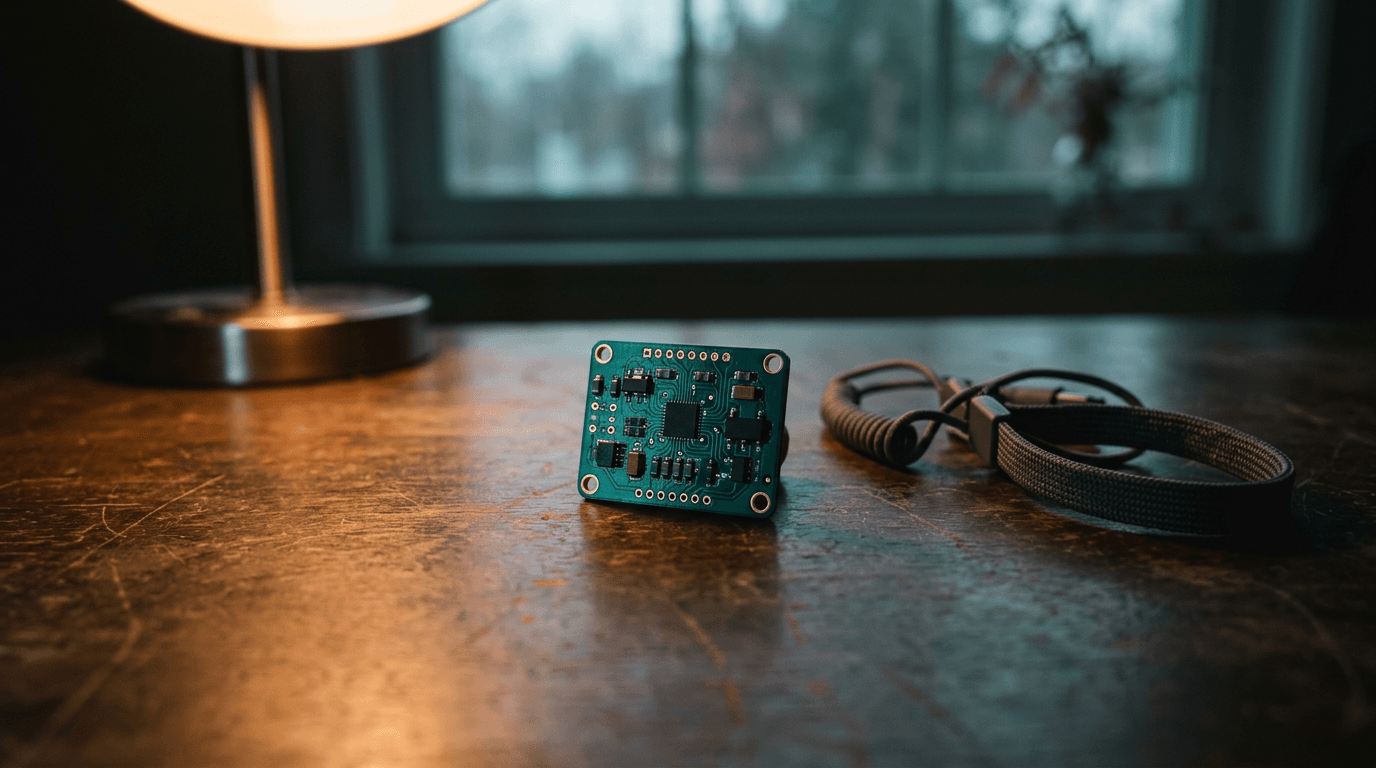
The sensor layer is the raw data. In smart buildings, that means IoT sensors measuring temperature, humidity, and power draw. The data arrives with gaps, spikes, and drift. A sensor that slowly goes out of calibration produces a trend that looks like a real change rather than a fault. The model cannot tell the difference unless you give it a reason to.
The model layer is where most of the academic attention sits. Recurrent neural networks like LSTMs are popular because they handle sequences natively and can learn temporal dependencies without heavy preprocessing. Autoencoders learn a compressed representation of normal patterns and flag anything that reconstructs poorly. Some newer work uses graph neural networks to model relationships between multiple sensors, catching anomalies that are only visible when you look at the whole network rather than one stream.
The app layer is the alert. This is where the human meets the system. A model that outputs an anomaly score is not enough; someone has to decide what to do with that score. The industry perspective points out that the literature often focuses on detecting anomalies in the raw distribution, but practitioners care about anomalies that are not explained by known factors—like a sensor reading that is odd given the weather and the time of day. That distinction changes the entire modeling approach.
Edge Cases: Where It Gets Interesting
Edge cases are where anomaly detection earns its keep. Consider a building's energy consumption. A sudden drop might be a sensor failure, or it might be a holiday when the building is empty. A sudden rise might be a malfunctioning HVAC unit, or it might be a scheduled event. The model needs auxiliary data—calendar, weather, occupancy—to disambiguate. The industry paper highlights this exact gap: the two quantities of interest are anomalies in the raw value and anomalies that are not explained by other factors. Most academic work only handles the first.
Another edge case is the definition of an anomaly itself. A point that is unusual in isolation might be part of a slow drift that the model has learned to accept. Conversely, a point that is within normal bounds might be anomalous because it arrives at the wrong time. The temporal context matters as much as the value.
Prototype-based methods try to address this by learning representative patterns and comparing new sequences to those prototypes. They provide a form of explanation: "this sequence is anomalous because it doesn't match any of the typical patterns we've seen." That is useful for a human operator who needs to understand why the alert fired, not just that it fired.
What Breaks (and Why That's Useful to Know)
What breaks first is the assumption that normal is static. Real systems drift. A building's energy profile changes with the seasons. A server's load changes with the user base. If the model is not retrained, it will flag the new normal as anomalous. If it is retrained too aggressively, it will start accepting real anomalies as normal.
What breaks second is the alert threshold. Choosing a threshold is a business decision, not a technical one. The cost of a false alarm versus the cost of a missed detection determines where you set it. The industry paper notes that alerting often requires external knowledge to decide whether a behavior is expected—knowledge that is hard to encode in a loss function.
Finally, the sensor itself breaks. A loose connection produces intermittent spikes. A failing battery produces a slow decline. These faults are not anomalies in the data; they are anomalies in the data generation process. Catching them requires models that look at the sensor's behavior over time, not just the values it reports.
Knowing these failure modes is useful because it tells you where to spend your engineering effort. If your sensor data is clean and your problem is well-defined, a simple threshold on prediction error might be enough. If your data is messy and your anomalies are context-dependent, you need a graph-based approach or a prototype-based explanation layer. The choice is not about which model is newest; it's about which layer of the system is most likely to break.
FAQ
Why is choosing the alert threshold so hard?
Because it's a business decision masquerading as a technical one. The threshold encodes the cost of a false alarm versus the cost of a missed detection. If you set it too tight, you page people for noise; too loose, and real problems slip through. There's no universal right answer—it depends on your operational context.
Can a simple model work for anomaly detection?
Sometimes, yes. If your data is clean and your anomalies are well-defined, a threshold on prediction error can be enough. But most real-world data is messy, and anomalies are context-dependent. That's when you need more sophisticated models—graph-based for multi-sensor, prototype-based for explainability—or you'll drown in false positives.
How do I know if my sensor is failing versus the system is actually anomalous?
You can't tell from the raw values alone. A slow drift could be a calibration issue or a real change in the environment. You need to look at the sensor's behavior over time—consistency, noise patterns, and correlation with other sensors. If the sensor itself is the problem, no amount of model tuning will fix it.